Production performance module
IDOM, through the adoption of the international OEE standard, provides the controller with a set of efficient and immediate indicators to optimize production, minimize costs and guarantee business continuity .


Plant availability is an immediate value for understanding the impact of unplanned stops in a production process.
The reduction in the number of plant downtimes implies a reduction in energy consumption and a greater flow rate.

The working speed of the production plant, in relation to the nominal speed, is an important driver for understanding whether the mode of use (settings, batches of raw material, etc.) is suitable or there is room for improvement.
The increase in performance implies a reduction in energy consumption and a greater flow rate.

Quality is a fundamental parameter for understanding the impact of waste/non-compliant products in the production process.
Waste represents a cost for different contexts (energy, raw material, production time).
Using an OEE (Overall Equipment Effectiveness) monitoring module offers numerous benefits to companies looking to improve the performance of their plants. Here are some examples:
- Improvement of efficiency: identification of the factors that limit the efficiency of the systems, allowing the company to intervene and improve their performance .
- Cost reduction: the company can identify plant inefficiencies and take measures to reduce production costs, increasing the company’s profitability .
- Greater plant availability: tracing the causes of any interruptions or plant shutdowns, allowing the necessary measures to be taken to guarantee their availability.
- Quality improvement: Identification of the causes of defects or inefficiencies in production, allowing measures to be taken to improve product quality.
- Improvement of safety: identification of any problems or malfunctions of the systems, helping to improve their safety.
- Greater competitiveness: increase in efficiency and consequently, increase one’s competitiveness on the market.
In summary, the use of an OEE monitoring module offers numerous advantages to companies, allowing them to improve plant efficiency, reduce production costs, improve product quality, increase safety of the plants and the competitiveness of the company
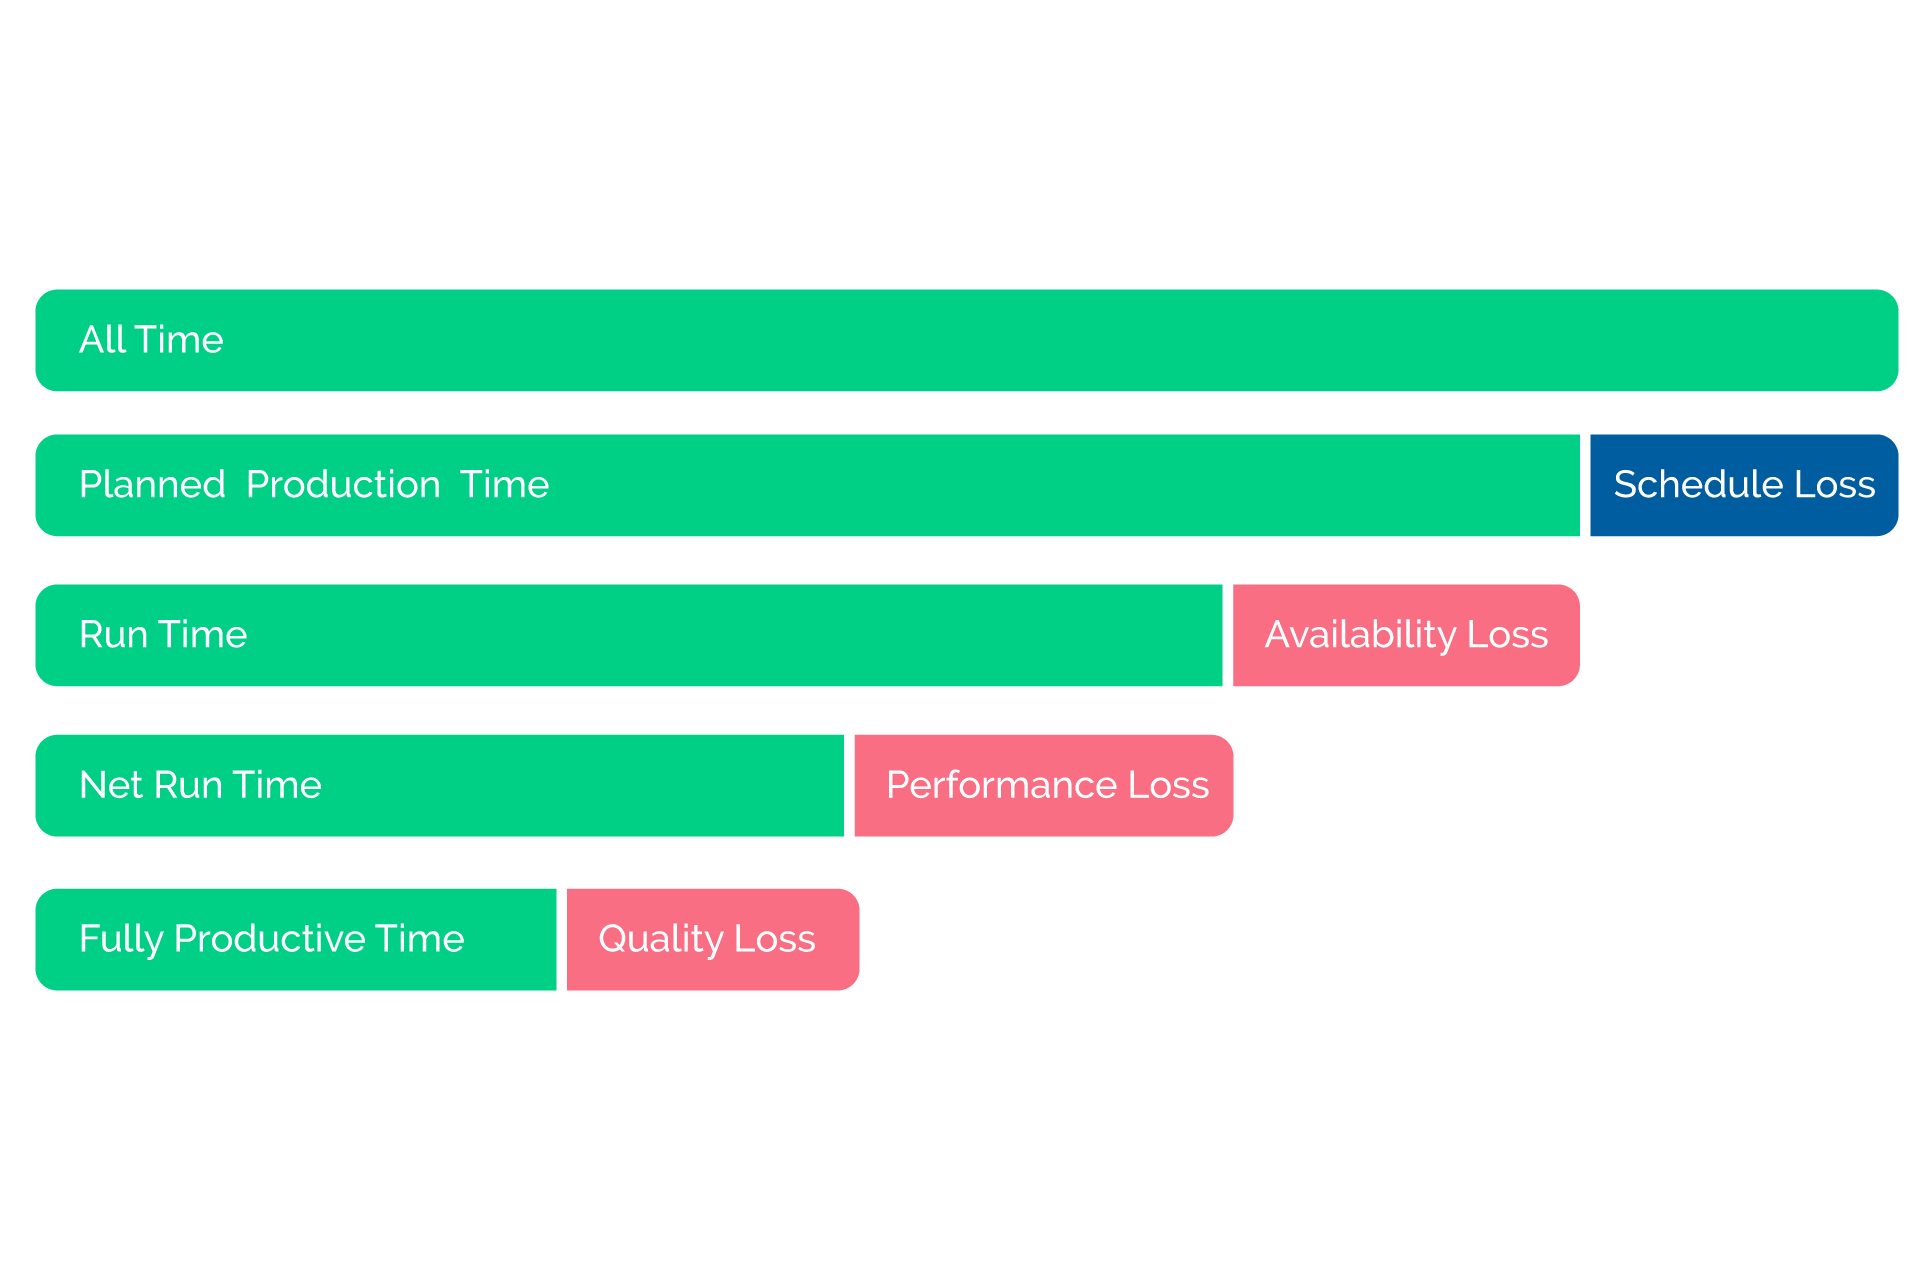
Measurable timing and impact areas of indices
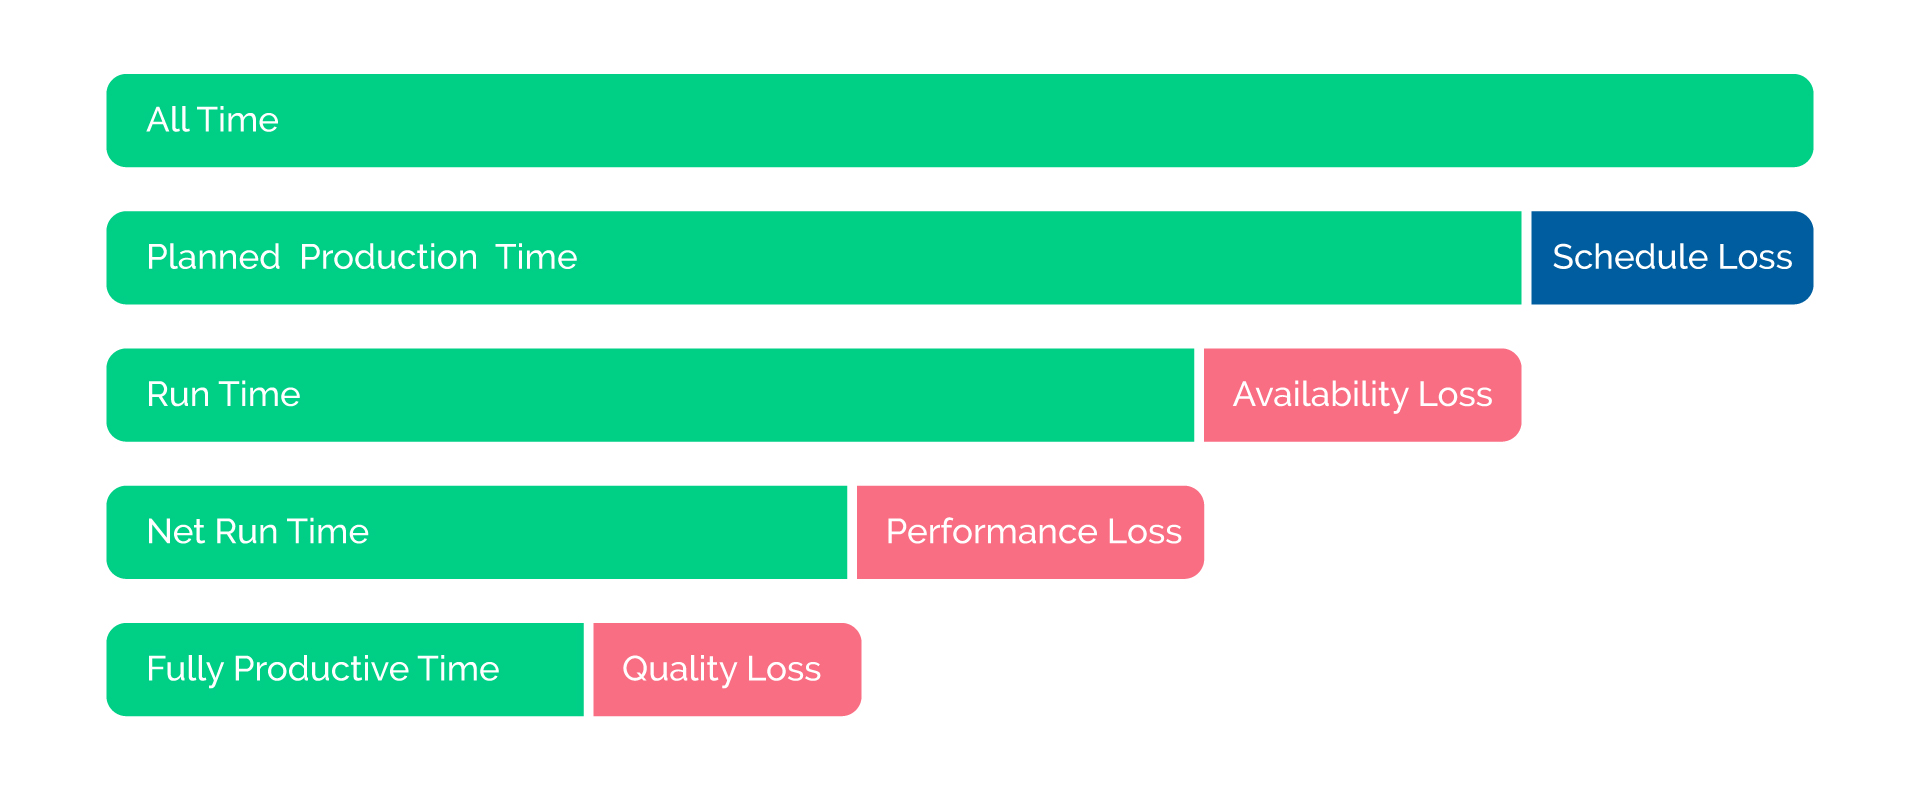
| Leak | OEE factor |
|---|---|
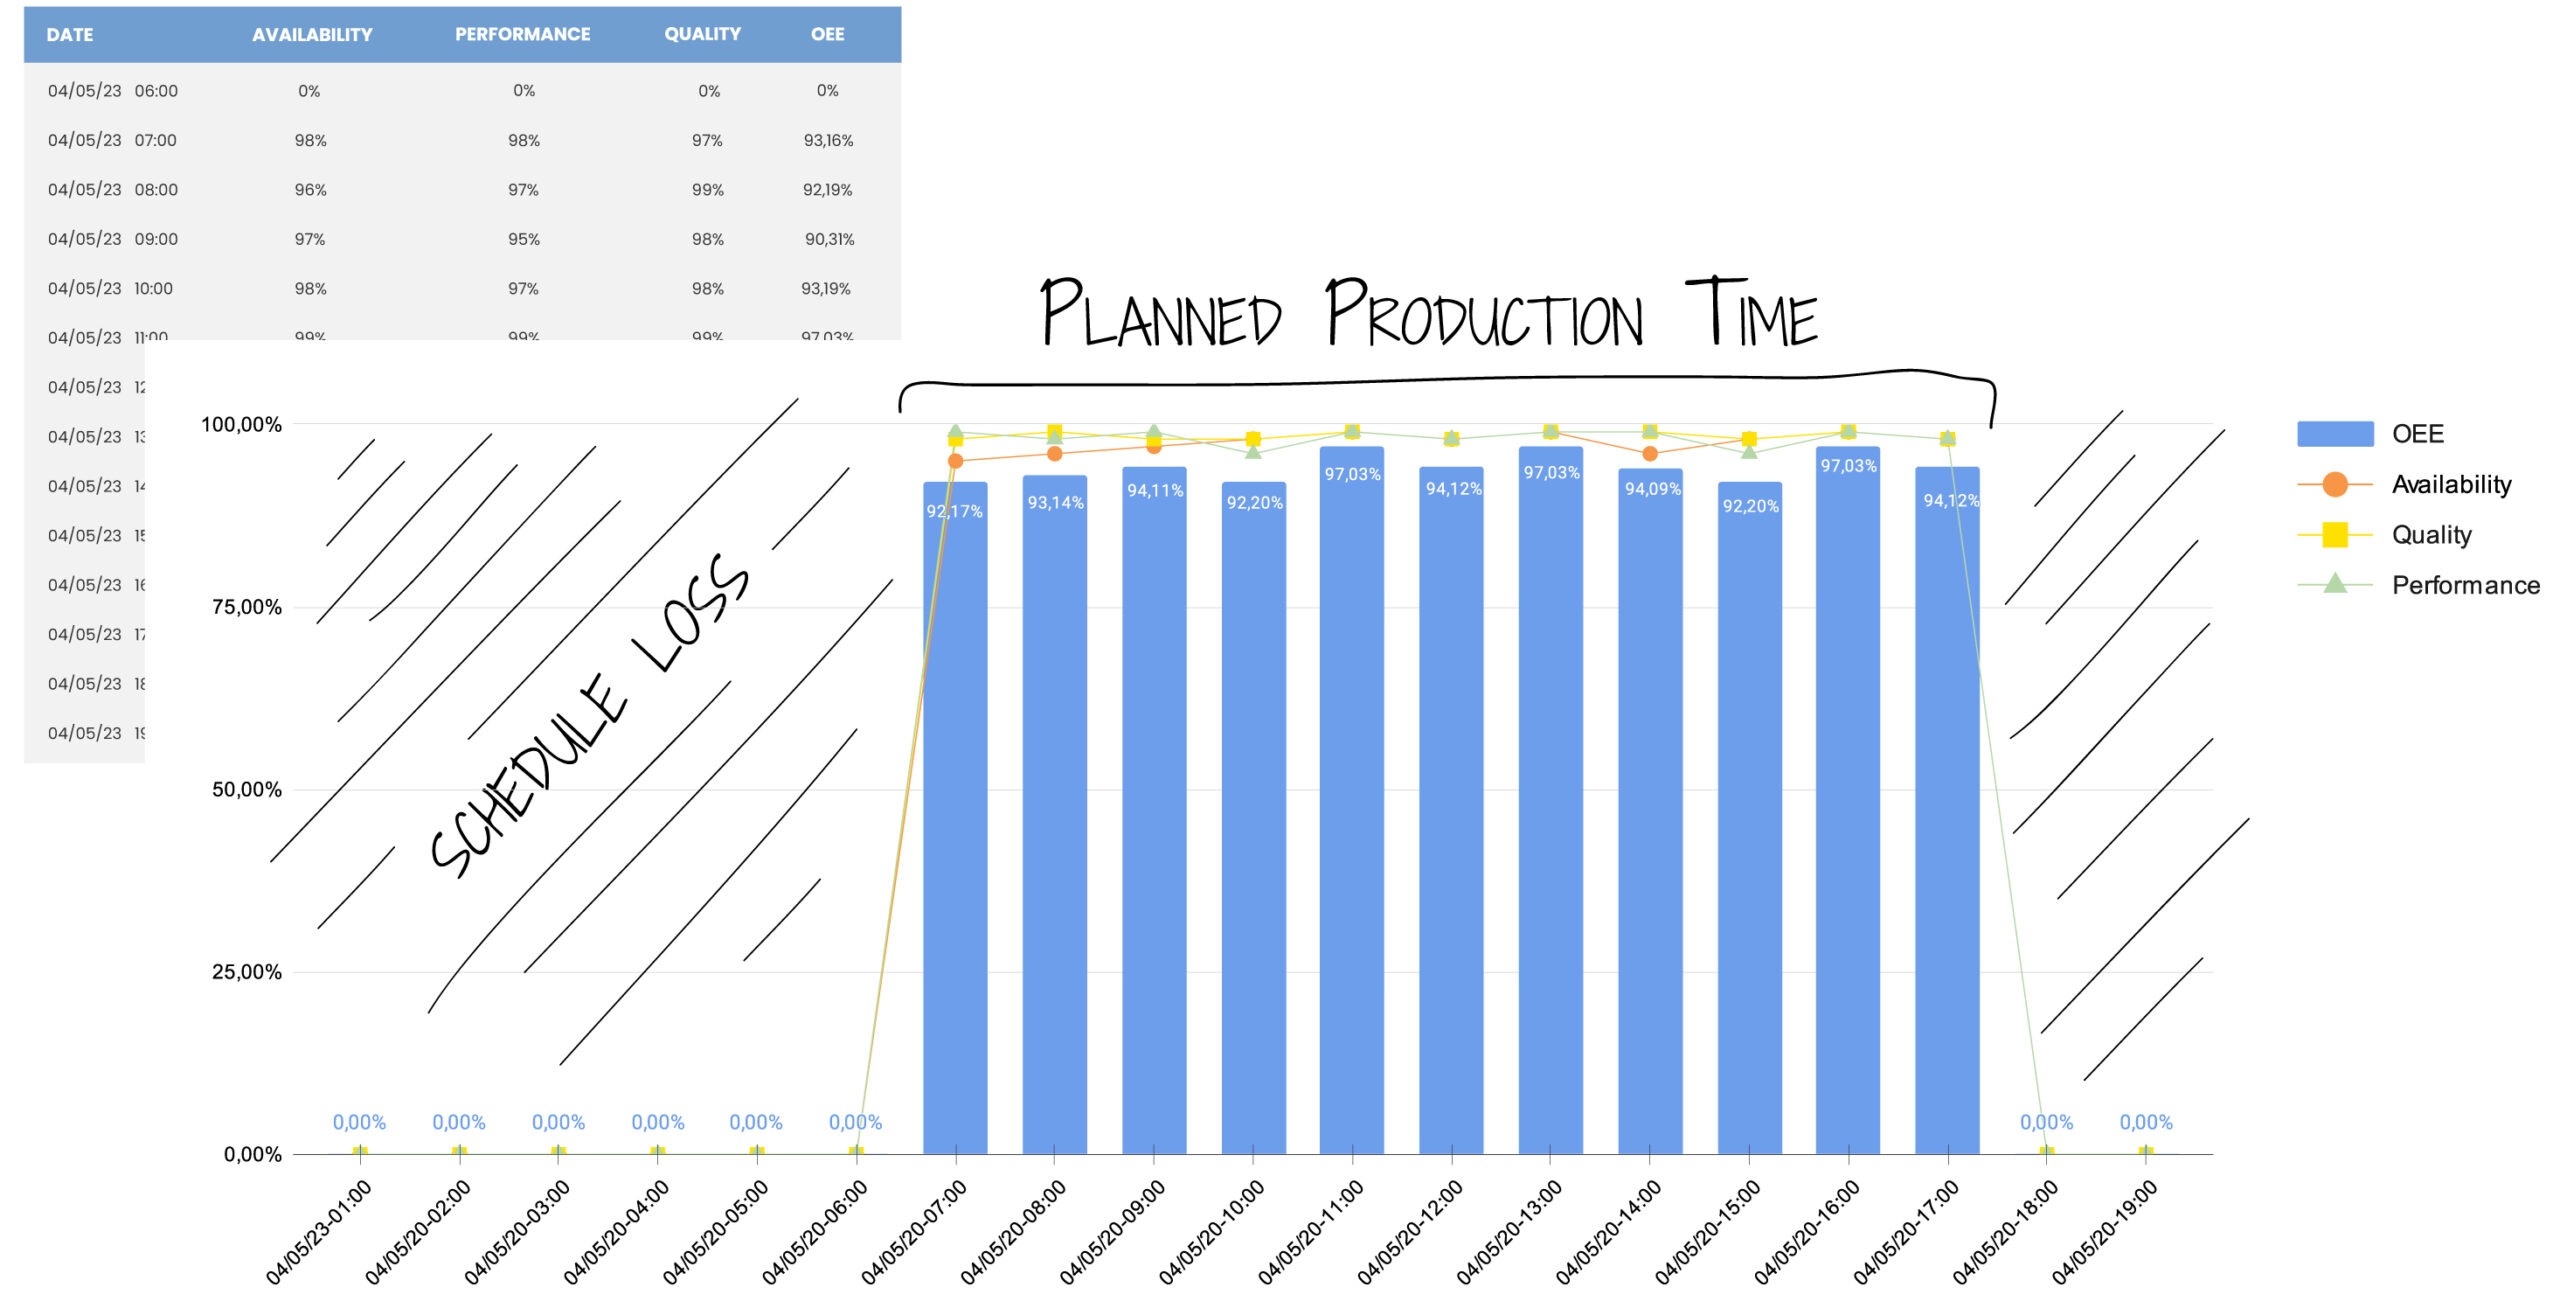
| Schedule Loss | Excluded from the OEE calculation (relates to the TEEP calculation). |
| Availability Loss |
|
| Average Minimum Demand |
|
| Quality Loss |
|
Improve OEE by eliminating the Six Big Losses
The calculation of Overall Equipment Effectiveness allows us to plan maintenance engineering activities in such a way as to reduce inefficiencies and production losses.
A good starting point for improving the effectiveness of a system is to eliminate the Six Big Losses. Each of these Six Big Losses is in fact correlated to at least one of the three indicators that make up Overall Equipment Effectiveness.
Let’s look in more detail at the Six Big Losses that have a direct impact on production and how we can eliminate them:
| OEE FACTOR | Six Big Losses | Post |
|---|---|---|
| Availability | Unplanned stops | Eliminate machine downtime
Every machine downtime translates into a decrease in the availability rate. The most common method to eliminate or at least reduce downtime is to prepare adequate maintenance plans and preventive maintenance actions in order to limit the number of failures of our equipment and monitor the status of our assets. |
| Planned stops | Speed up set-up and adjustment times
Speeding up or reducing the number of activities that lead to plant stops or micro-stops for set-up operations, for example, allows us to increase plant availability. |
|
| Performance | Small stops | Minimize micro-stops
Minor interruptions, which cannot be classified as downtime, can cause production losses which, added together, sometimes lead to a non-negligible reduction in the performance of a system. |
| Slow cycles | Solve production speed issues
Sometimes plants deviate from expected production levels for a variety of reasons. When this deviation begins to become significant, it is best to look for the cause and correct the malfunction. |
|
| Quality | Production rejects | Minimize process defects
It involves correcting errors and problems in the product production process to limit the number of non-compliant pieces and therefore increase the Quality indicator score. |
| Startup rejects | Prevent periods of reduced production
It occurs when a machine is not working in the optimal conditions expected for the production of quality parts equal to the required standards (for example parts produced while the plant is still working in a set-up phase or has not yet reached the conditions necessary to become fully operational). |
Tools made available by the platform
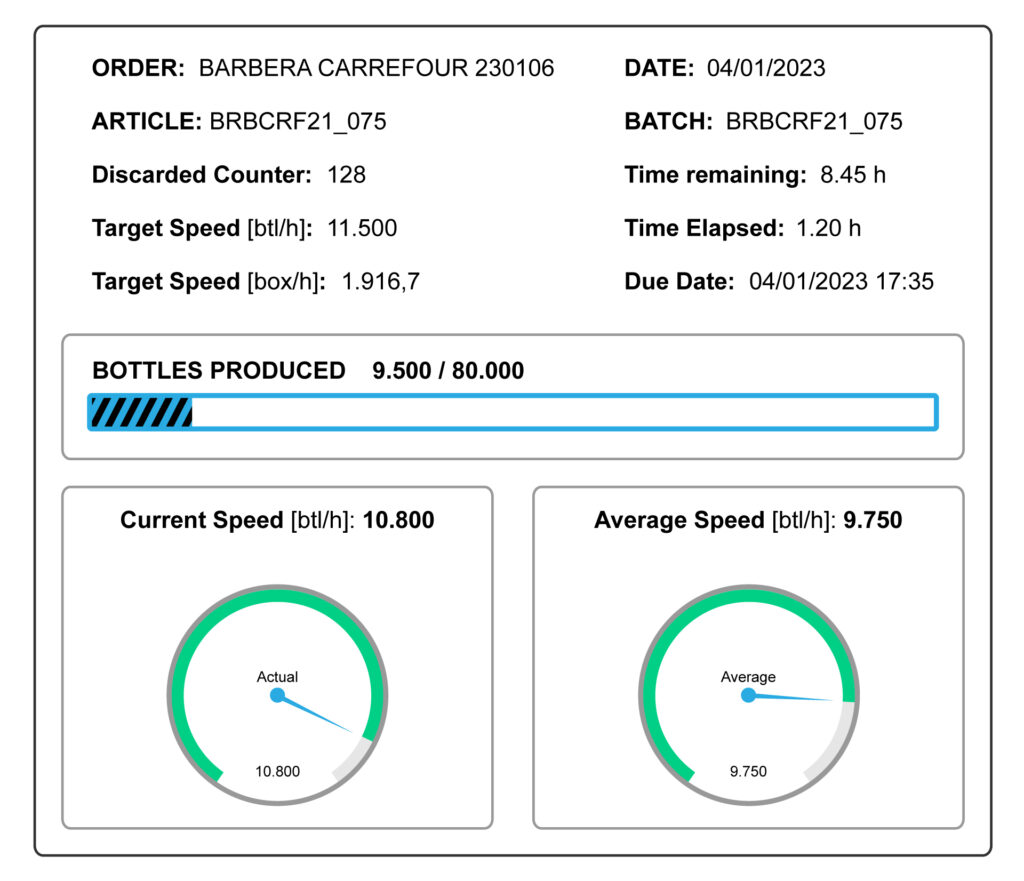
- Plant OEE
In the dedicated section, the OEE values, components and timing are reported in a concise and timely manner.
| OEE Parameter | Description | % |
|---|---|---|
| Availability | Run Time/Planned Production Time | 98% |
| Performance | Net Run Time/Run Time | 97% |
| Quality | Fully Productive Time/Net Run Time | 94% |
| Overall OEE | Fully Productive Time/Planned Production Time | 89.36% |
| Planning efficiency | Planned Production Time/Plant Calendar | 100% |
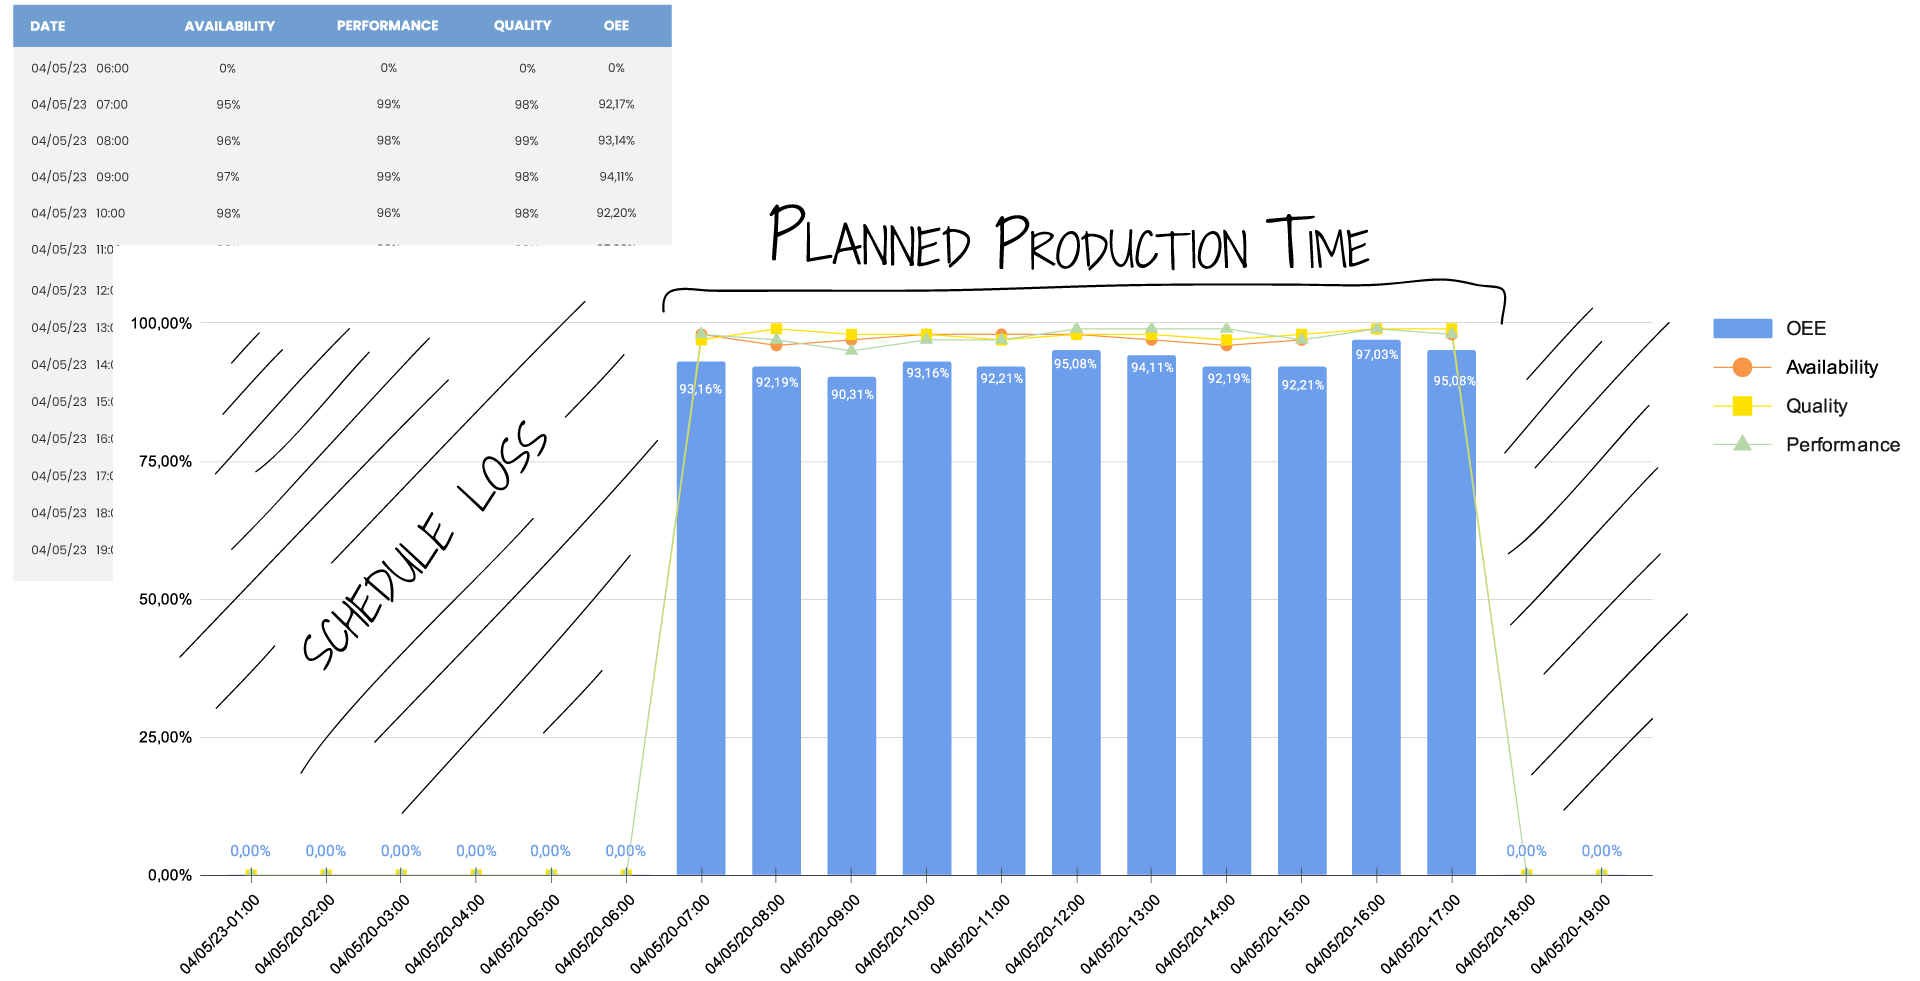
- Plant OEE trend on a time basis
It is possible to evaluate the evolution of the OEE trend, for the specific time range through the specific functionality made available on the user interface.
- Machine OEE trend on a time basis
the system allows you to evaluate, on a temporal basis, the evolution of the OEE index for each individual machine on the line.
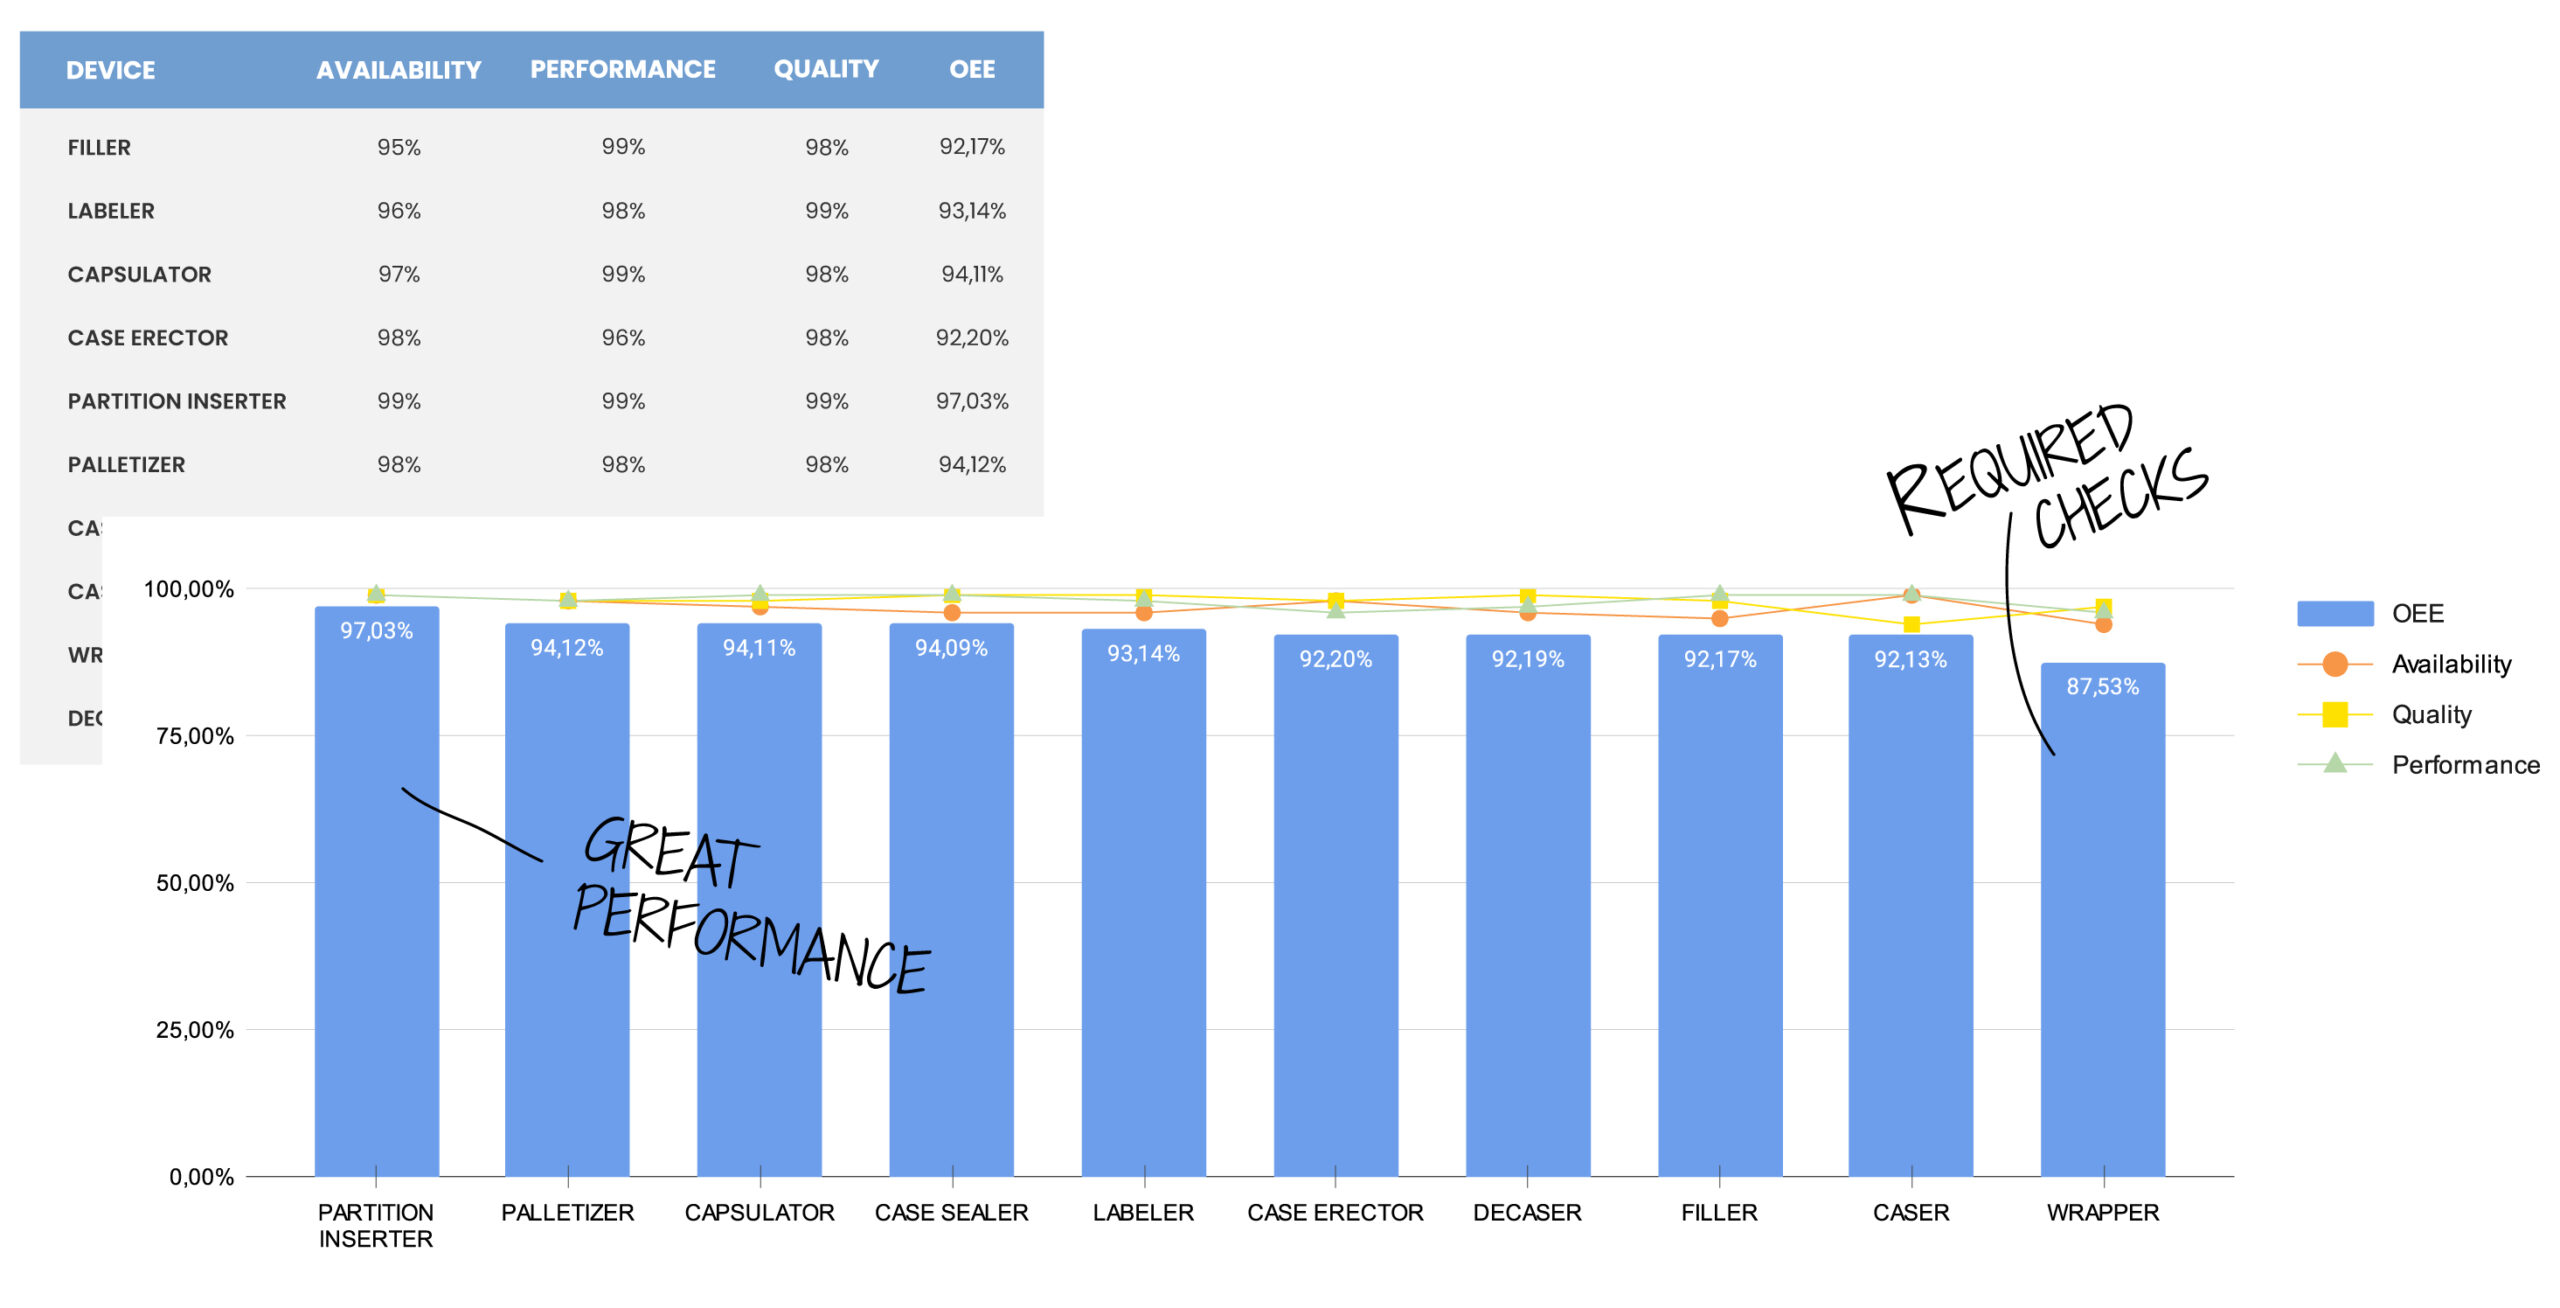
- Machine comparison table (OEE classification)
The platform, in addition to the global plant index, provides a detailed report relating to the performance achieved by each spot, ordered in such a way as to obtain a ranking to allow evaluations relating to the intervention points.
- Analysis of processed batches over a time range
The calculation model, for the time range under analysis, provides a detailed list of the lots involved in the calculation.
- Reporting
the platform, in addition to allowing the timely extraction of the OEE report from the graphic interface, offers the possibility of configuring an automatic report generation and sending metric for a specific list of recipients.
- Synoptic of the system shown
Two easily usable links are made available to project both the current day’s OEE and the performance analysis for the current batch onto any plant monitors.